Grafana
Add forecasted data into actual data
1.
yhat_lower, yhat_upper, yhat
2.
Data to create alerts for SSO session monitoring: yhat_lower of Session count
3.
Using InfluxDB 1.4 (abs function is not yet supported)
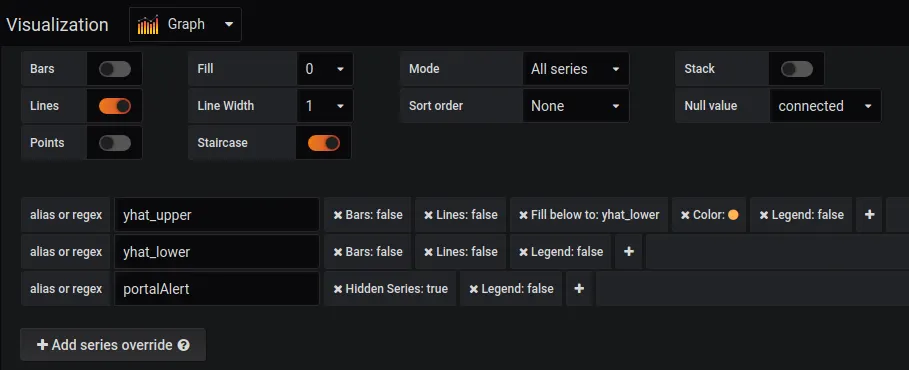
Visualization Setting
•
Hide forecasted yhat
•
Hide legend, represented as a different color for forecasted yhat lower and upper data
•
Hide lines for alert
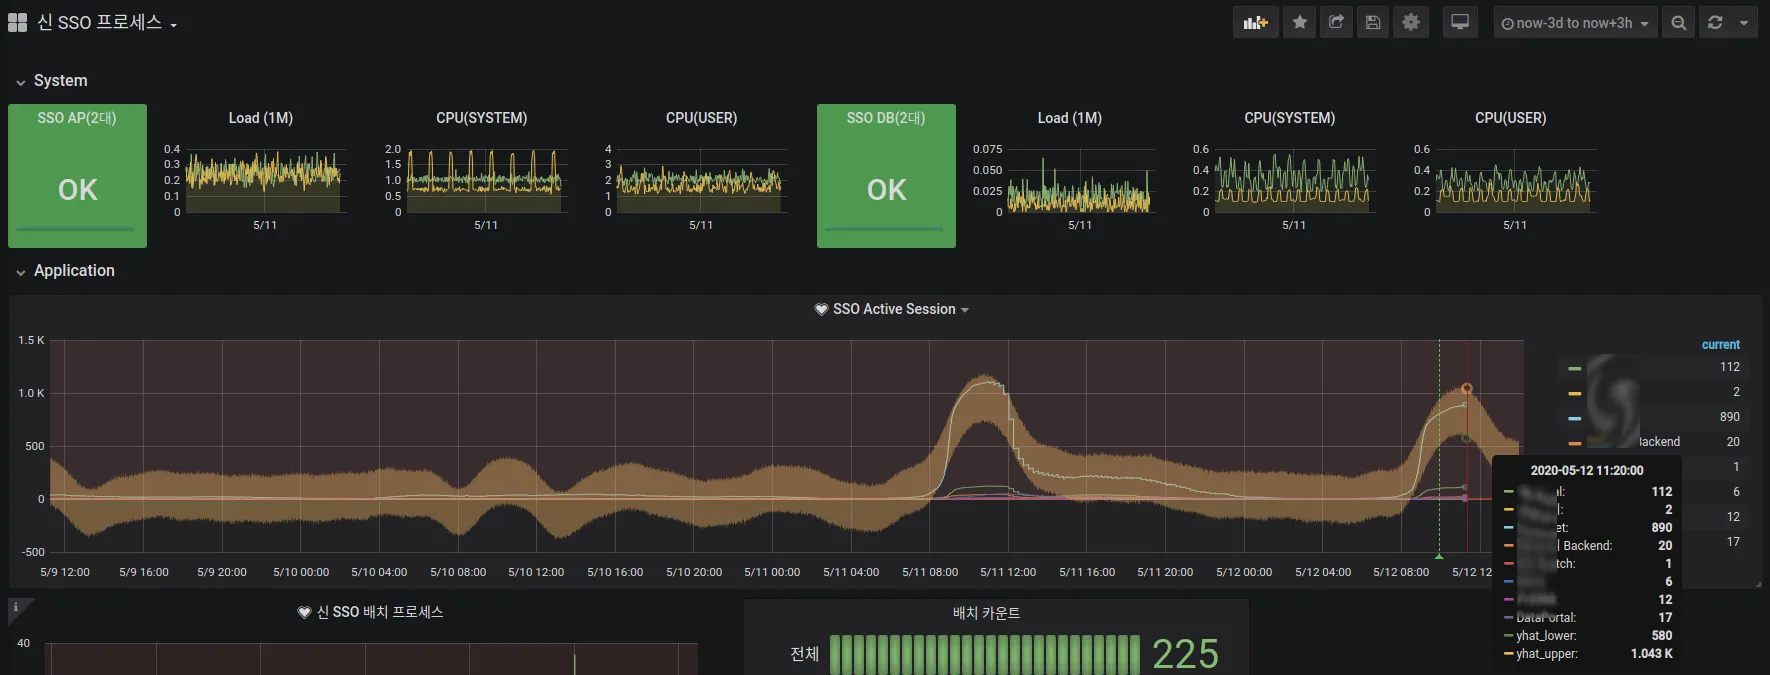
Dashboard with forecasting applied
Alert setting
•
Alert when yhat_lower session count is lower than forecasted yhat_lower
•
Alert when session count is over 2000 since there are just 1000 employees at the company


